Last verified July 17, 2026. Every brand, estimated revenue figure, traffic number and ad count below was pulled live from TrendTrack’s Shops module on a paid account, not from a press release.
Copy the wrong brand and you inherit a problem you never had.
Fashion Nova sells 25,000 products on 403 live Meta ads. Loop Earplugs sells 57 products on 4,131. Both are working right now, and they are answers to completely different questions.
So pick the job before you pick the brand. This page maps five jobs to ten stores, then hands you the exact filters behind the list so you can rebuild it yourself next quarter.
A DTC brand sells straight to the buyer through its own storefront, with no retailer in between. The ten here come from TrendTrack’s Market Leaders & DTC Brands view on July 17, 2026: each one clears 40,000 monthly visits, 150 live ads in 30 days, and a best-seller priced at or under $500.
Disclosure: some links on this page are affiliate links. If you subscribe through them we may earn a commission at no extra cost to you. We tested every TrendTrack feature mentioned here on a paid account.
What “model a DTC brand” actually means
Direct-to-consumer means the brand owns the storefront, the customer relationship and the margin. It also carries the acquisition cost itself, which is the part most lists skip.
That ownership is why this page can exist at all. Every brand below runs a public Shopify storefront, so its catalog size, ad volume and traffic are measurable from the outside without anyone leaking anything. For a wider gallery, see our pick of the best Shopify stores to learn from.
But modeling is not copying. You cannot buy Fashion Nova’s fourteen-year head start or SKIMS’ founder, so the transferable part is always the structure: the ratio of creatives to products, the angle, the testing cadence, who runs the ads.
| What you are trying to do | Brands to model | What actually transfers |
|---|---|---|
| Sell one product that fixes one problem | Loop Earplugs, Nothing | Creative volume aimed at a tiny catalog |
| Run a catalog that sells itself | Fashion Nova, Princess Polly | Merchandising depth and low paid dependence |
| Get other people to run your ads | Gymshark, Alo Yoga | Creator whitelisting at scale |
| Sell something people think about first | Fast Growing Trees, Mejuri | Category authority on a considered purchase |
| Scale a narrow range with volume testing | Comfrt, SKIMS | Testing cadence on a focused range |
Read the middle column as a shortlist, not a verdict. If none of those five rows is the thing keeping you up at night, the brand you should study is the one solving your bottleneck, and it is worth being clear-eyed about what scaling a store actually takes before you go shopping for a role model.
How these ten were pulled (the criteria)
We did not rank these by taste. The Shops module ships an official locked view called Market Leaders & DTC Brands, and it is a preset with hard thresholds rather than an editorial opinion, which you can load on any TrendTrack plan and check against this page.
Three filters define it: at least 40,000 monthly visits, at least 150 live ads over the last 30 days, and a best-selling product priced at or under $500. On July 17, 2026, 3,621 stores cleared all three out of 1,873,015 indexed.
Source: TrendTrack Shops module, Market Leaders & DTC Brands view, checked July 17, 2026.
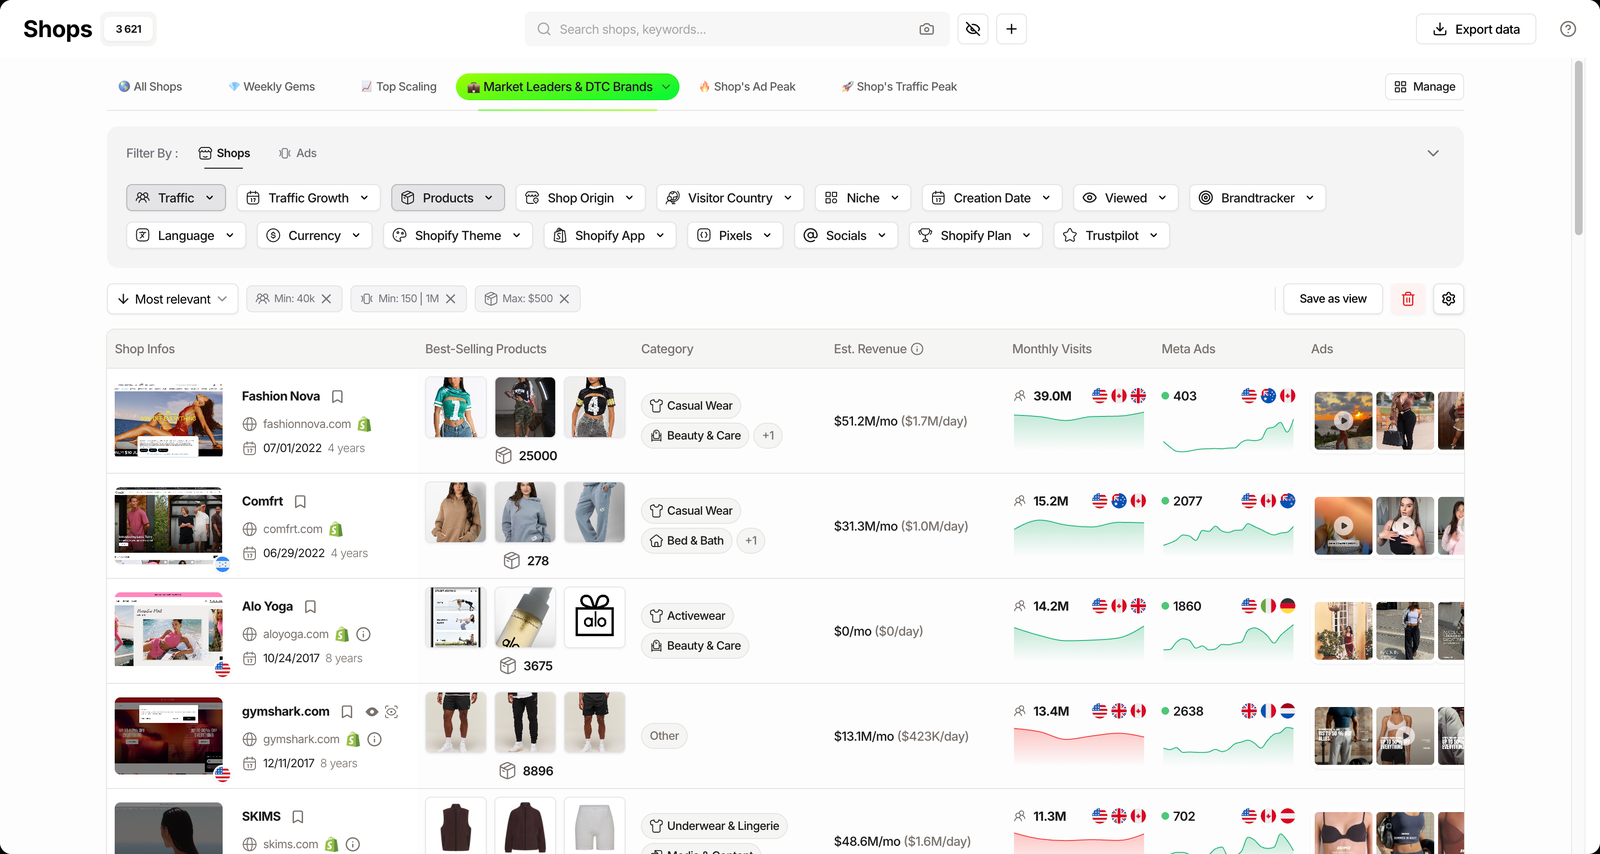
Those thresholds cut real things on purpose. The $500 ceiling drops furniture and high-ticket equipment, and the 150-ad floor drops any brand that grew without paying Meta, so treat the view as a map of advertised DTC, not of DTC as a whole.
Read the data honestly: Est. Revenue is a model, not a filing. It is useful for ranking stores against each other and useless as a P&L, and it is not computed everywhere: Alo Yoga pulls 14.2M monthly visits and still shows $0/mo.
The creation date is not brand age either. SKIMS shows 09/04/2025 in the app because that field tracks the Shopify storefront it detected, not the year the company launched.
Related guide
Shops Database Tutorial: 1.8M Shopify Stores, 17 Filters
Every filter behind this view, and how to bend it to your niche.
The ten at a glance
Scan the gap between columns rather than the revenue figure alone. Two brands with similar traffic and wildly different ad counts are running opposite playbooks, and that contrast is the useful part.
| Brand | What they sell | Est. revenue | Visits | Ads (30d) |
|---|---|---|---|---|
| Fashion Nova | Casual wear | $51.2M/mo | 39.0M | 403 |
| SKIMS | Underwear and lingerie | $48.6M/mo | 11.3M | 702 |
| Mejuri | Fine jewelry | $42.9M/mo | 3.8M | 687 |
| Comfrt | Comfort apparel | $31.3M/mo | 15.2M | 2,077 |
| Fast Growing Trees | Live plants and trees | $19.0M/mo | 7.4M | 148 |
| Princess Polly | Casual wear | $14.3M/mo | 5.9M | 30 |
| Gymshark | Activewear | $13.1M/mo | 13.4M | 2,638 |
| Nothing | Consumer electronics | $11.8M/mo | 5.7M | 698 |
| Loop Earplugs | Filtered earplugs | $3.2M/mo | 4.0M | 4,131 |
| Alo Yoga | Activewear | N/A (not computed) | 14.2M | 1,860 |
Every revenue figure above is estimated by TrendTrack from external signals, and the ad counts are what the library held on the day we checked. Both move.
The ten playbooks, one by one
1. Fashion Nova: the catalog does the selling
The ratio is the story. 39.0M monthly visits and only 403 live ads means paid social is a garnish here, not the engine.
What transfers to a smaller store is the merchandising logic, not the SKU count: a catalog wide enough that returning buyers always find something new, refreshed fast enough that the homepage is never the same twice. TrendTrack estimates the store at $51.2M/mo, which tells you the model is durable, not that you should go list 25,000 products tomorrow.
2. SKIMS: own a category word
SKIMS is the highest estimated revenue per visit in this group: roughly $48.6M/mo against 11.3M visits, versus Fashion Nova’s $51.2M against 39.0M.
That gap is what owning a category word buys you. People do not arrive to browse shapewear, they arrive for the brand, which cuts the persuasion work the ads have to do and shows up as a shorter, more efficient funnel.
3. Mejuri: premium pricing on a small catalog
Mejuri is the sharpest number on the page: an estimated $42.9M/mo from just 3.8M visits and 626 products.
Roughly one ad per product, which means creative is built around pieces rather than promotions. If you sell anything where the buyer wants to feel taste rather than get a deal, this is the ratio to study.
4. Comfrt: 278 products, 2,077 ads
Here is the inverse of Fashion Nova. Comfrt runs roughly seven live ads for every product it sells, and pulls an estimated $31.3M/mo doing it.
That is a testing machine, not a catalog. The lesson for a small store is that a narrow range is not a limitation as long as you are willing to keep generating angles against it, because the creative is what is being iterated, not the assortment.
5. Gymshark: let creators run the ads
Gymshark is the clearest whitelisting case in the index, and the Brandtracker exposes it directly: the Partnership Ads tab lists the creator pages running ads on the brand’s behalf, one row each.
This is the playbook you can copy at any size. Ads that run from a creator’s own page inherit that creator’s social proof, and you can see exactly which partners a competitor is scaling before you pitch the same ones.

Related guide
Brandtracker Tutorial: Track a Store’s Ads, Tests, Emails & LPs
Put any brand on this page under a tracker and watch its whole funnel.
6. Alo Yoga: the brand the estimate cannot read
Alo Yoga sits on 14.2M monthly visits with 1,860 live ads, and its Est. Revenue reads $0/mo.
Keep this one on the list precisely because of that hole. It is the cleanest reminder that the estimate is a model with blind spots, and that traffic plus ad volume are the harder signals when the revenue column goes quiet.
7. Loop Earplugs: one problem, 4,131 creatives
The most instructive row in the whole view. Loop Earplugs runs the highest ad count of these ten, 4,131, against the smallest catalog, 57 products.
That is around 72 live ads per product, which only makes sense when the product is one solution and the market is many different annoyances: concerts, offices, sleep, sensory overload. Same earplug, a different reason to buy in every creative, and that reframing is the single most copyable idea on this page.

8. Princess Polly: 5.9M visits on 30 ads
Thirty live ads. That is the entire Meta footprint behind 5.9M monthly visits and an estimated $14.3M/mo.
A store this size with a Meta footprint that small is being fed by something other than paid social, and with 16,134 products on the shelf the catalog is clearly doing work the ad account is not.
If your own ad spend is the only thing keeping the lights on, this is the counter-example worth staring at.
9. Fast Growing Trees: authority in a hard category
Shipping living trees to strangers is a logistics nightmare, and the store still pulls an estimated $19.0M/mo from 7.4M visits on just 148 live ads.
Hard categories protect you. When the operational barrier is high, competitors cannot simply clone your store in a weekend, and the marketing burden shifts from persuasion to reassurance: zones, guarantees, care guides.
10. Nothing: a 56-product electronics catalog
Consumer electronics on Shopify, 56 products, an estimated $11.8M/mo. Nothing proves DTC hardware still works without a marketplace listing.
The transferable idea is restraint. A tight range lets every launch be an event and every creative be about the object itself, which is the opposite instinct to most stores adding SKUs when sales stall.
Find the next one yourself
A list dates the moment it is published. The view behind it does not, so the useful takeaway is the three-step loop rather than these ten names.
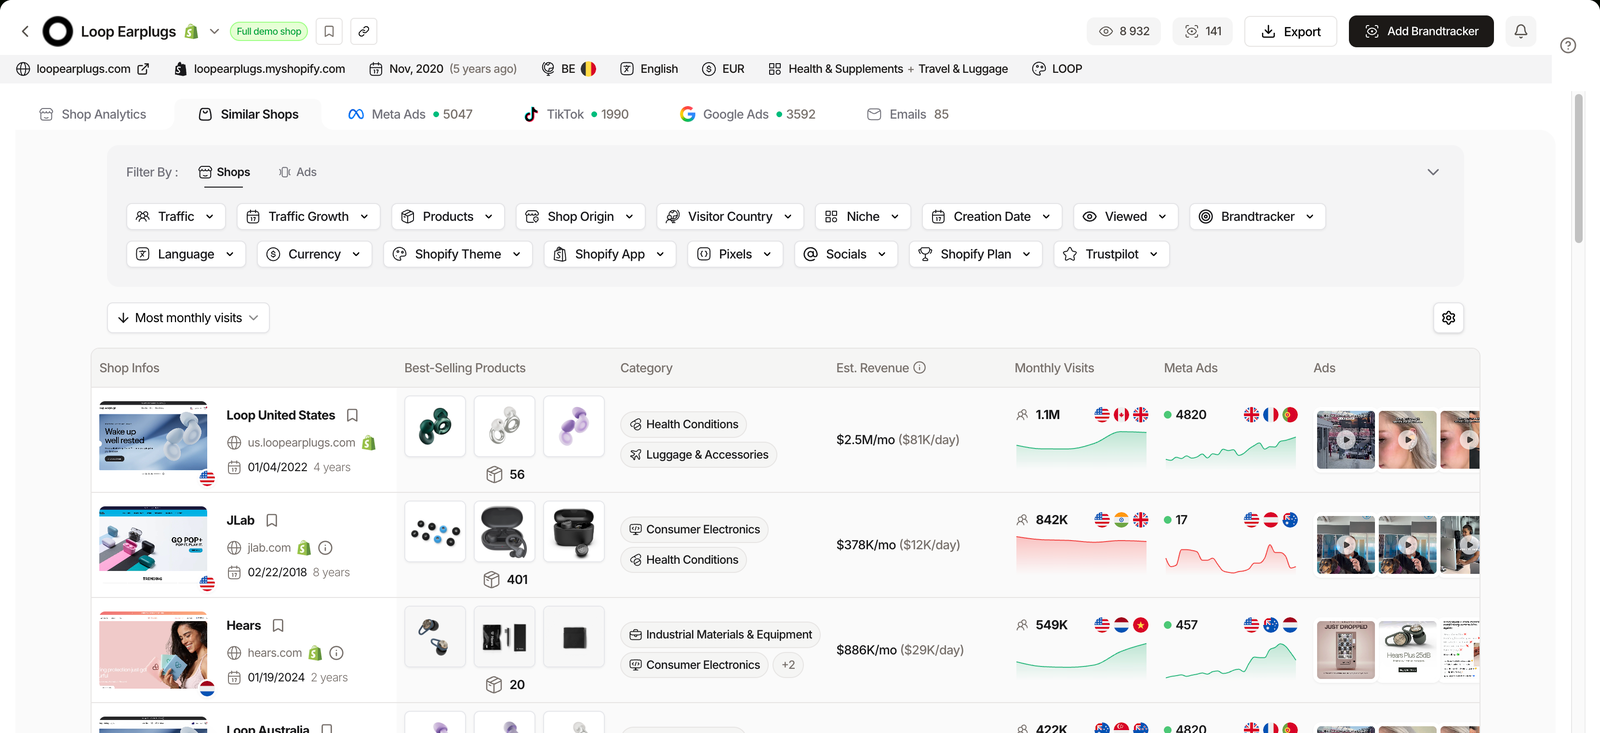
Step two has a shortcut most people miss. Open any store’s analytics page and the Similar Shops tab hands you around ten comparable stores with their live ads, product counts and traffic, which is how you go from one brand you admire to a peer group you can actually study.
Plan check: the Shops module, the 17 filters and the Est. Revenue column are all included from Starter ($59/mo), with unlimited stores and 2 Brandtracker slots. The Ads and Advertisers modules are not in Starter: browsing every creative a brand runs starts on Pro ($89/mo), which also lifts you to 30 trackers.
So the honest split is this: everything on this page came from a Starter-level module, while the Gymshark partnership teardown needed Pro. If you are deciding where that line falls for you, our breakdown of which plan unlocks what goes through it plan by plan, including the annual billing at $41, $62 and $104 per month.
FAQ
What makes a brand DTC?
Direct-to-consumer means the brand sells straight to the buyer through its own store, instead of routing through a retailer or a marketplace. It owns the customer relationship, the data and the margin, and it carries the acquisition cost itself.
Every brand on this page runs its own Shopify storefront, which is exactly why their traffic, catalog and ad activity are visible from the outside.
Are these revenue numbers real?
They are estimates, not audited figures. TrendTrack’s Est. Revenue column models a store’s monthly revenue from external signals, and it is directional rather than exact.
Treat it as a way to rank stores against each other, not as a P&L. The gaps are visible: Alo Yoga pulls 14.2M monthly visits and still shows $0/mo, because the estimate is not computed for every store.
Why does TrendTrack show SKIMS as a 2025 store?
Because the date tracks the Shopify storefront, not the company. SKIMS shows a creation date of 09/04/2025 in the app, which reflects when that storefront was detected or rebuilt, not when the brand launched.
Use the field to spot new stores and replatforms, and never read it as brand age.
Can I see these brands’ ads on the cheapest plan?
Partly. Starter at $59/mo includes the Shops module, so the store list, the filters and the Est. Revenue column all work, plus 2 Brandtracker slots.
But the Ads and Advertisers modules are not in Starter, so browsing every creative a brand runs starts on Pro at $89/mo.
How often does this list change?
The underlying view is live, so the ranking moves on its own. When we pulled it on July 17, 2026, 3,621 stores cleared the criteria out of 1,873,015 indexed.
We re-check this page quarterly and log any brand we swap out, but the honest answer is that you should reload the view rather than trust a list.
The pattern behind all ten
Line them up and the common thread is not budget. It is that each one picked a constraint and pushed it to an extreme: 57 products or 25,000, thirty ads or four thousand, a category word or a creator network.
None of them is a middle-of-the-road store doing everything adequately. That is the part worth stealing, and it costs nothing to decide which extreme is yours before you spend another dollar on traffic. For the shifts shaping all of them, read the ecommerce trends defining 2026.
Which ten stores would this view return in your niche?
The Market Leaders & DTC Brands preset is one click inside the Shops module, and it is included from $59/mo (or $41/mo billed annually). Add your niche filter and the list rebuilds itself around your market.