Last verified July 2026. The method and every TrendTrack counter below were checked live on a paid account.
Most “winning product” advice tells you to scroll your TikTok feed until something feels viral. Operators who actually scale do the opposite.
A viral clip is a starting rumor, not proof. By the time a product is all over your feed, hundreds of stores are already testing it, and your margin is gone.
The sellers who keep finding winners read signals that repeat over time: real store revenue, traffic that is climbing, ads that keep running, and demand that holds. This guide is the hub for that method, and every section links deeper into the sub-topics.
A winning product is one with proven, sustained demand you can source at a margin and reach with paid ads. You spot it with four signals: real estimated revenue, stores already scaling, ads that keep running, and rising search demand, not by how viral a clip feels.
In this guide
What a winning product really is (and isn’t)
Strip away the hype and a winning product is boring to define. It sells enough, consistently, to fund profitable ads. That is it.
What it is not: a one-day spike, a gadget that only demos well, or a trend that already peaked. Those get clicks and refund requests. A real winner keeps selling after the novelty fades because it solves something or scratches a durable want.
Green flags
- Ads that have run for weeks, not days
- Store traffic and live ad counts both rising
- Clear problem it solves or strong wow factor
- Room for a healthy markup after shipping
Red flags
- Only proof is a single viral video
- Fifty stores already running the same creative
- Thin margin once you add shipping
- Fragile, heavy, or easy to buy locally
It also helps to know which kind of winner you are chasing, because the archetype changes your whole plan.
Keep this split in mind for the rest of the guide. Every signal below is really just a faster way to sort green flags from red ones before you spend.
Where winning products actually come from
The sources matter, because most of them lie to you. A product can look huge on TikTok and be dead on arrival for a store that has to pay for traffic.
Here is how the common sources rank as reliable signals, from noisiest to strongest.
| Source | What it tells you | Reliable signal? |
|---|---|---|
| TikTok / FYP scrolling | Something got views once | No |
| Product-of-the-day lists | What everyone else is copying | Limited |
| Competitor ad libraries | Which creatives keep running | Yes |
| Scaling Shopify stores | Traffic and revenue trending up | Yes |
| Search-demand tools | Whether interest is rising or fading | Yes |
Notice the pattern. The reliable sources all show behavior over time, stores spending, ads persisting, demand climbing. The weak ones show a single moment.
That is also why saturation is a timing problem, not a product problem. A good product gets copied, the copies compress the margin, and the sellers who got in first on a fresh angle keep the profit. Reading behavior over time is how you catch a product on the way up instead of the way down.
Related guide
Winning product finder tools compared
The tools that turn these signals into a shortlist, side by side.
Signal 1: real revenue, not vanity virality
Views are cheap. Revenue is not. The first thing you want to know about a product is whether the stores selling it are actually pulling money, at scale.
This is where a store-and-ad database earns its keep. Instead of guessing, you filter across the whole Shopify landscape and read the estimates directly.
TrendTrack database counters, checked July 2026.
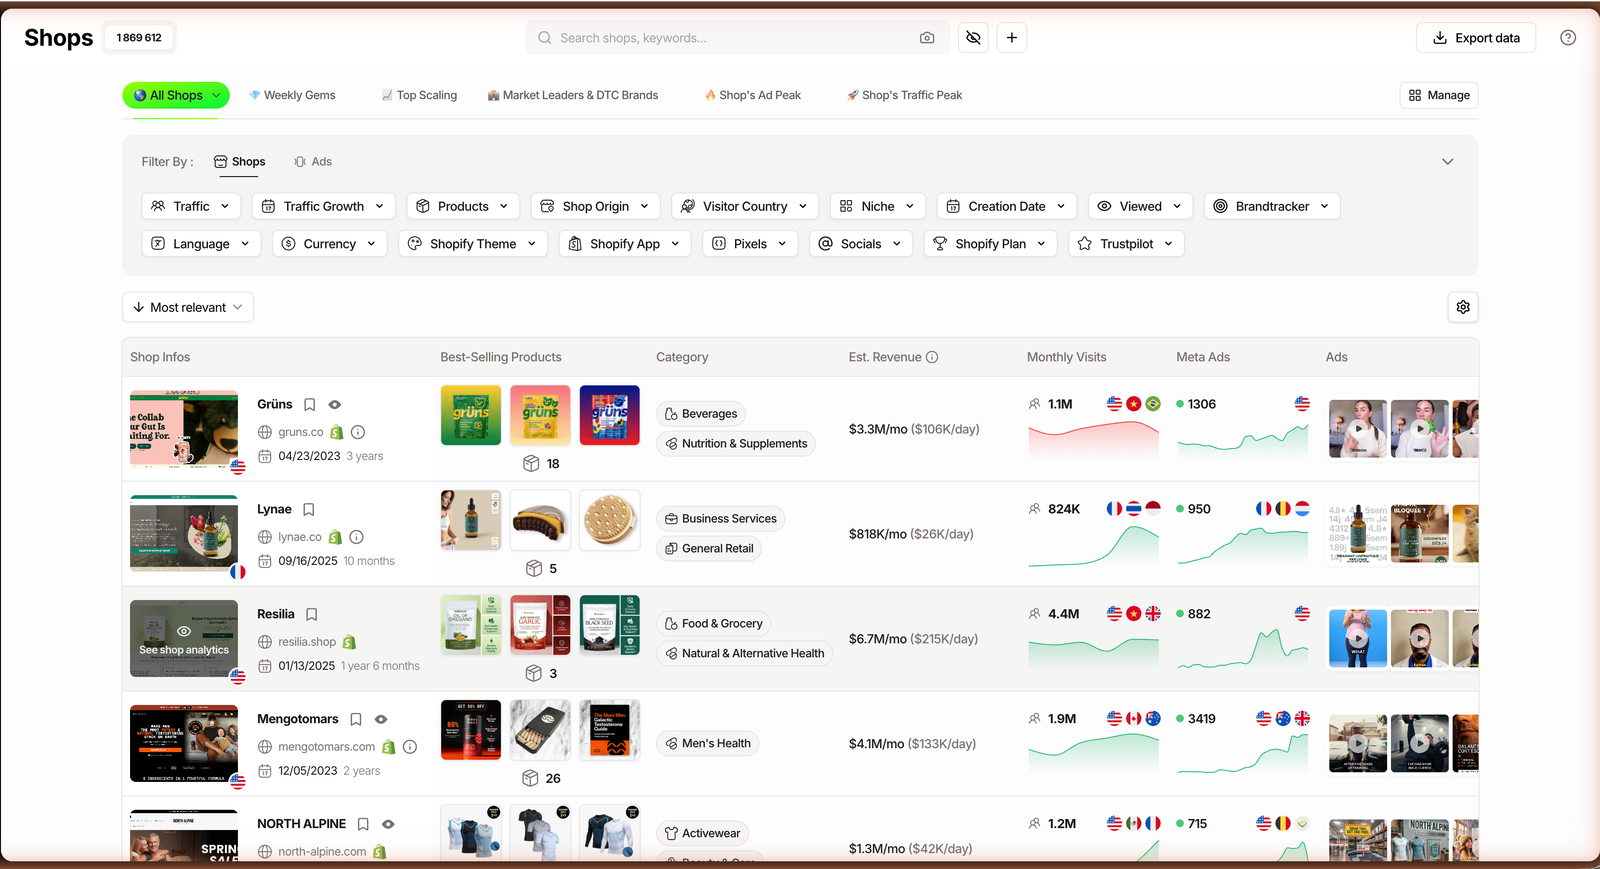
To go from a single product to every store selling it, the AI Image Search lets you drop in a product photo and returns the stores that carry it. Line up their estimated revenue side by side and you can see who is actually scaling it, reading each number relative to the niche: a $50K/mo estimate is small in supplements and large in a narrow hobby.
One caution that never goes away: Est. Revenue is an estimate, not audited revenue. Treat it as a speedometer read from outside the car, directional, not a bank statement. A store estimated near the top of its niche is still a much safer bet than a random viral clip.
Signal 2: stores already scaling
A single big month means little. A store whose traffic and live ad count are both climbing is telling you the product behind that growth is working right now.
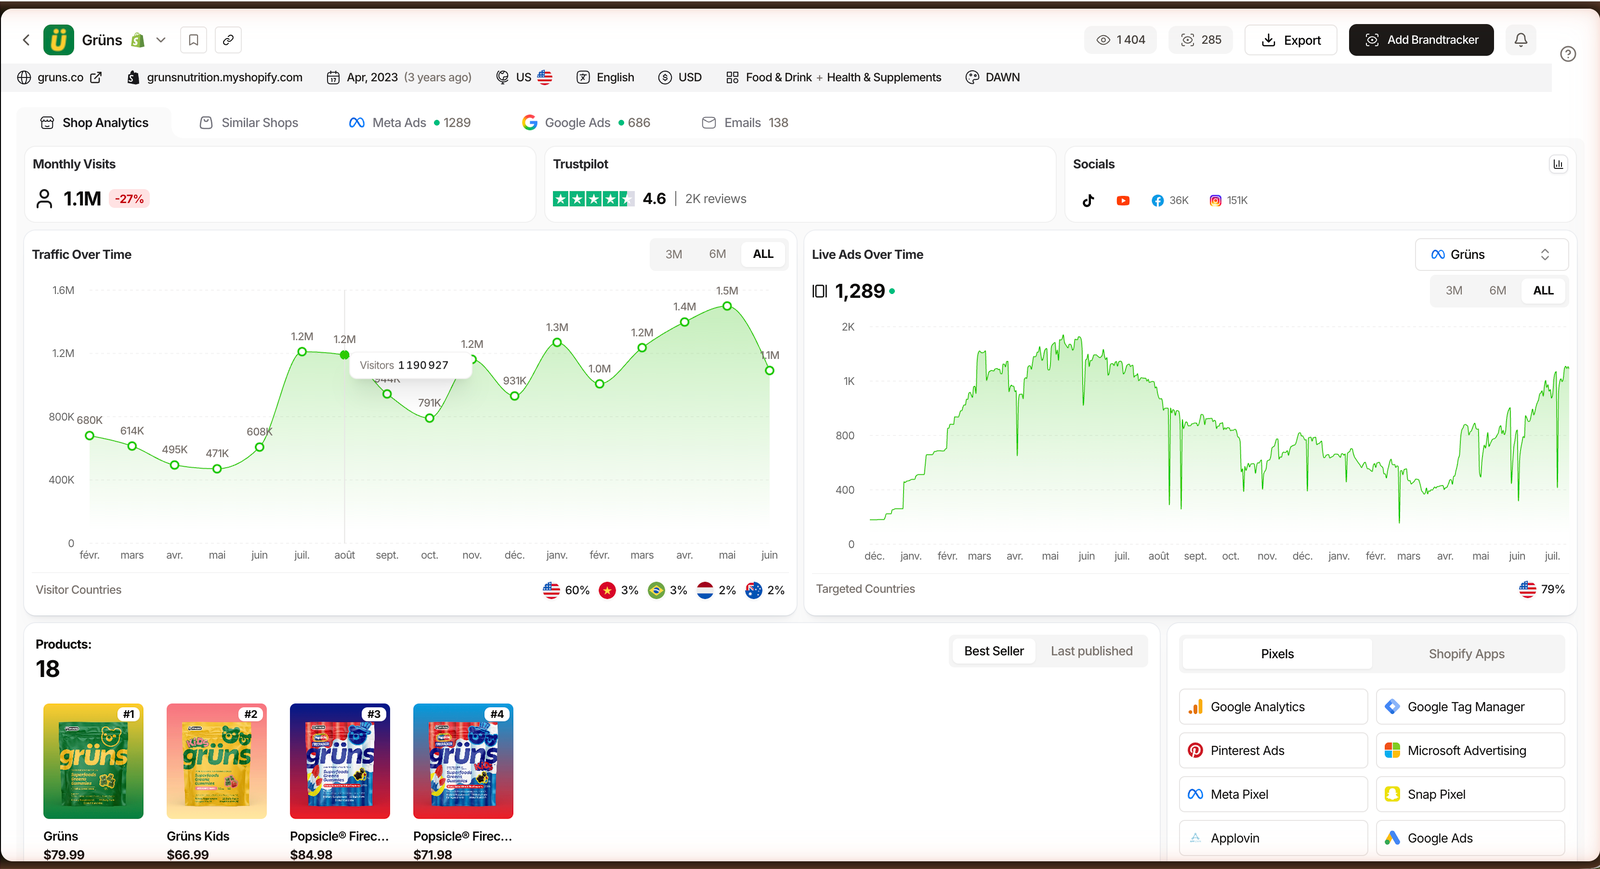
Reverse-engineering is the whole game here. Find a store on the way up, open its analytics, and read which products it launched right before the traffic curve bent upward. That is your candidate.
The fastest-growing Shopify stores are the richest hunting ground for this, because their growth is fresh and their winners are not saturated yet.
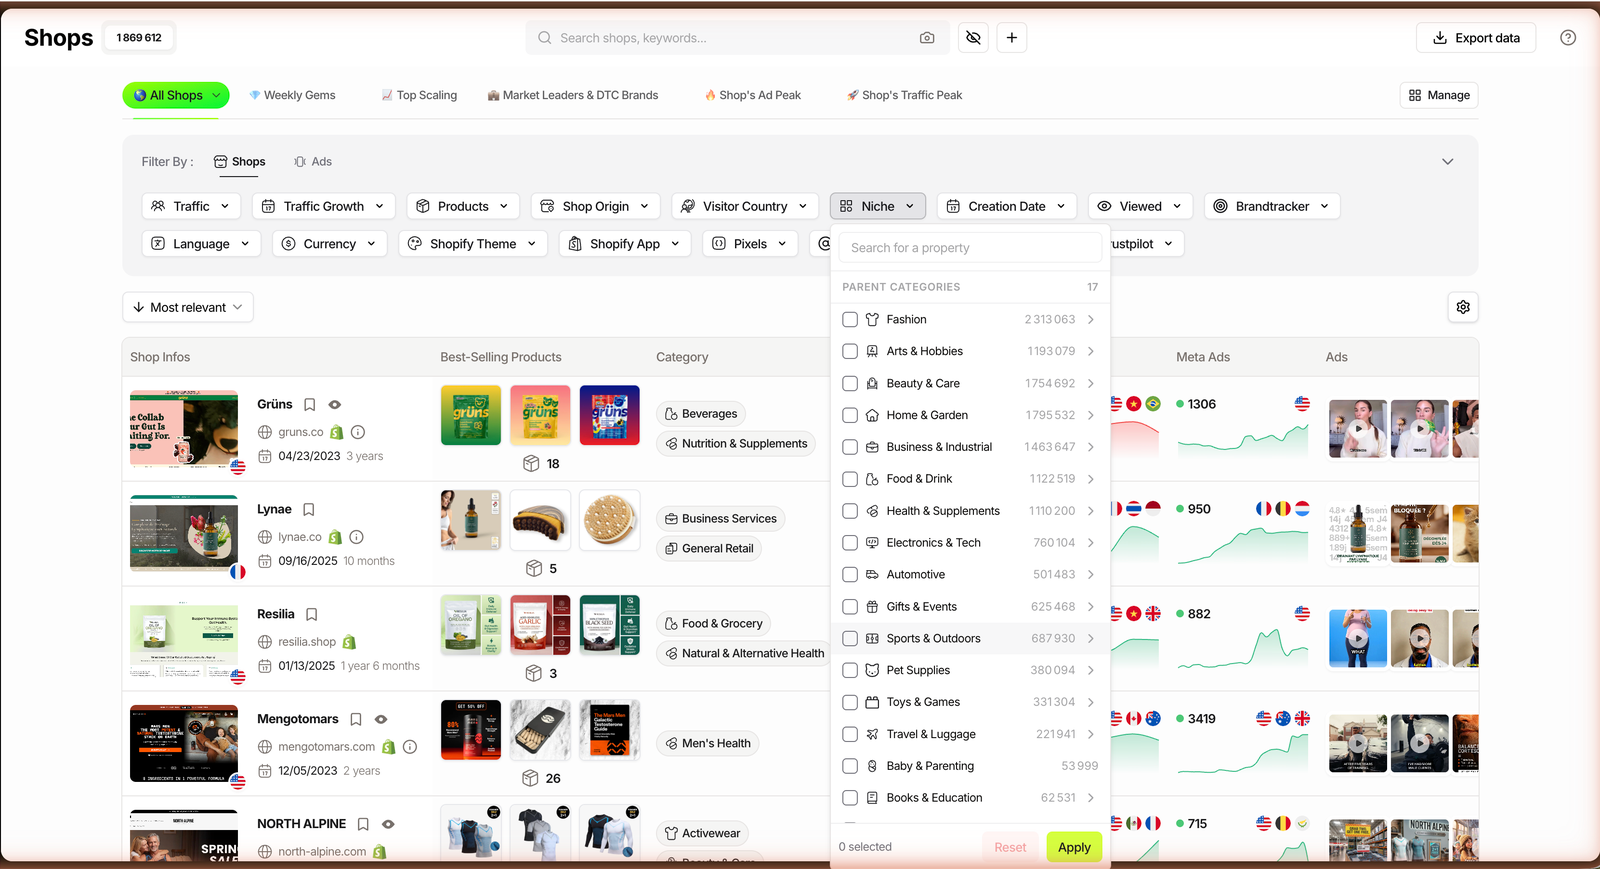
Layer the filters and the noise drops fast. Set traffic growth to rising over three months, narrow to your niche, and you go from 1.87M+ stores to a short list you can actually read.
Two more reads sharpen that list. A store’s Similar Shops tab surfaces around ten competitors in the same lane, and its product page shows each item’s launch date, so you can line up a fresh launch against the exact week traffic bent upward.
Signal 3: ads that keep running
Advertisers kill losers quickly. So an ad that has been running for weeks is a paid vote of confidence, and reading which ads are actually winning is one of the sharpest product signals you have.
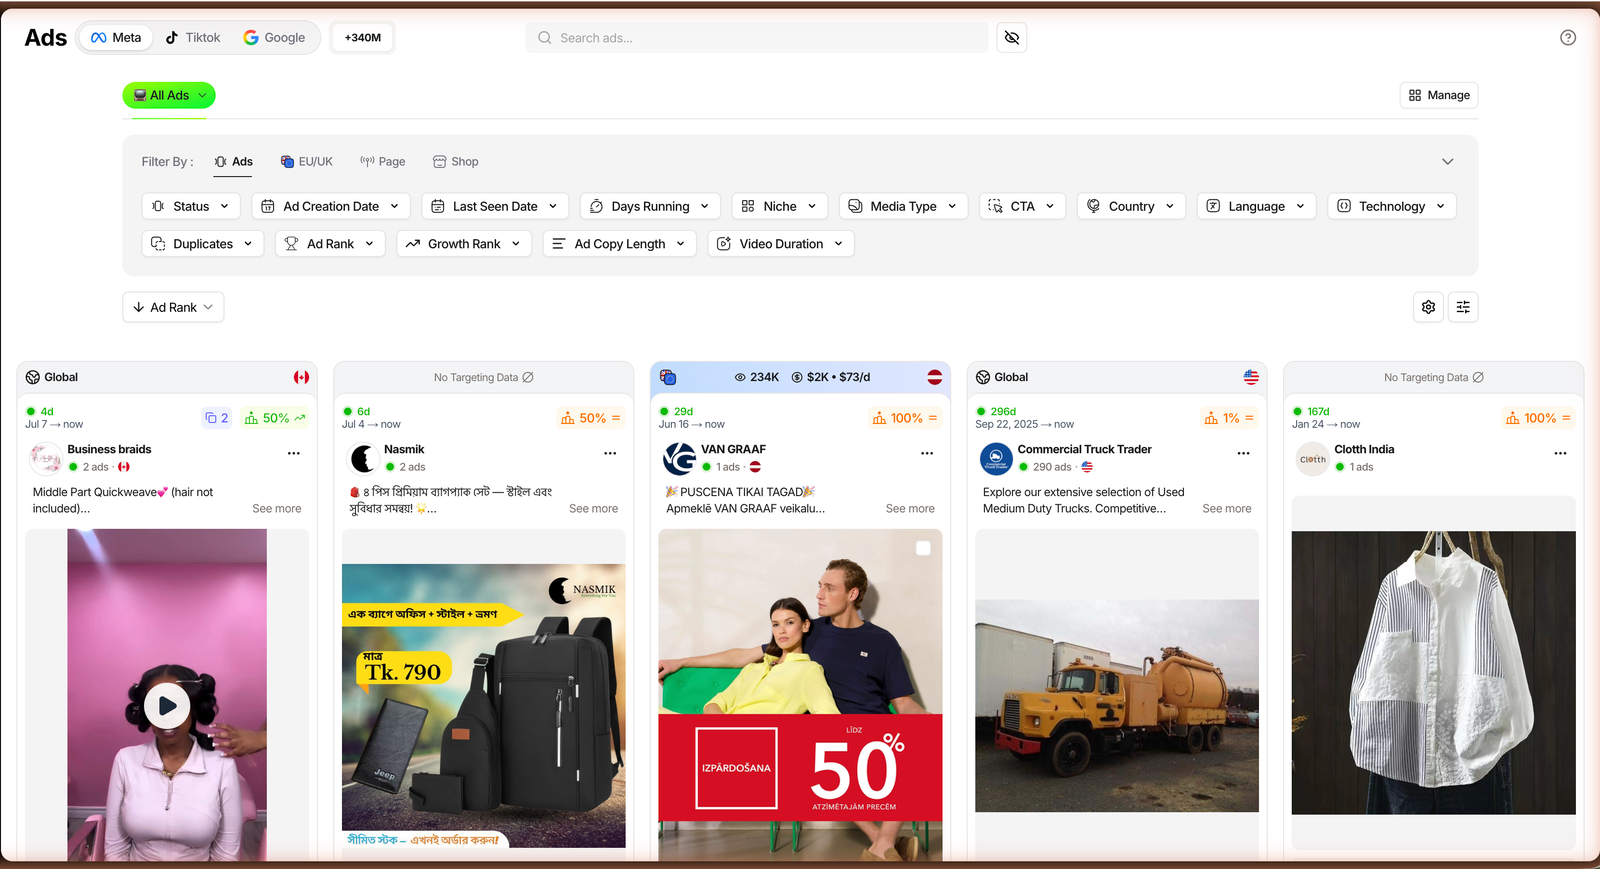
Ad Rank is TrendTrack’s ranking of winning ads, derived from Facebook data and available even without EU impression numbers. It shipped on January 29, 2026. Sort by it, or by longest active, and the durable creatives float to the top.
The tell you want is a product that shows up in multiple long-running ads across different stores. That means the demand is broad, not one lucky account.
Plan check: ad spy (the Ads and Advertisers modules) starts on Pro ($89/mo). Starter ($59) covers store search, two Brandtrackers and the free Chrome extension, but not the ad libraries.
One detail worth chasing is copy reuse. When the same hook or ad copy shows up across several of a store’s ads, that is the message the market rewarded, and it is a shortcut to the exact angle you should test first.
You can also see who is amplifying it. If a product turns up in Partnership Ads, where a brand runs ads from a creator’s account, that is a store putting real budget behind creators, one more sign the product is carrying weight.
Signal 4: demand and timing
A product can pass the first three signals and still be a bad buy if you are late. Timing is the fourth signal, and it is free to check with search-demand research tools.
Start with demand on Google Trends. Rising or steady interest over twelve months is a green light; a sharp peak that is already rolling over is a warning you missed the wave.
Quick timing test: pull a 12-month and a 5-year Google Trends view. If both point up or hold flat, timing is neutral to good. If the 5-year line is falling while a short spike sits on top, you are late to a fad.
Then layer seasonality. In the store database you can filter by creation date and even by seasonal events, which surfaces products that spike on a calendar, gifting, outdoor, back-to-school, so you launch before the curve, not after it.
Cross-check against the niche filter. If a category is stacking new stores and rising traffic at the same time search interest climbs, the timing is on your side. If interest is flat while everyone piles in, you are buying into saturation.
The vetting checklist (before you spend a cent)
Signals shortlist a candidate. A checklist decides whether it survives contact with your wallet. Run every candidate through the same four phases before you order a sample or build a page.
| Phase | The question | Pass looks like |
|---|---|---|
| Demand | Is interest rising, not fading? | Steady or climbing over 12 months |
| Competition | Proven, but not saturated? | A few winners, not fifty clones |
| Margin | Room to profit after ads? | Markup covers product, shipping and CPA |
| Logistics | Can you ship it reliably? | Compact, sturdy, sourceable fast |
If a product fails any single phase, it does not mean discard it. It means fix that gap first, a better supplier for margin, a different angle for competition, before you commit budget.
Weight the phases by where you lose money. Margin and logistics are hard blockers, since no creative rescues a product you cannot ship at a profit. Demand and competition are softer, because a sharper angle or a slightly earlier launch can still turn a crowded market in your favor.
Where most sellers go wrong
Most failed product tests do not fail at discovery. They fail at judgment, chasing a signal that looks strong and ignoring the one that quietly kills the margin.
Common mistake
- Judging a product on one viral video
- Copying a creative everyone already runs
- Ignoring shipping weight and cost
- Launching after the trend has peaked
The fix
- Confirm long-running ads across stores
- Find your own angle from copy reuse
- Price the full landed cost first
- Check the demand curve before you order
None of these are exotic. They are the whole difference between a product that looks winning on a feed and one that stays winning on a profit and loss sheet.
Find your next winner faster
You can run this whole method with free tools and patience: Google Trends, public ad libraries, and the free Chrome extension for a quick store x-ray. It works; it just takes time.
Pulling revenue estimates, ad rankings, growth filters and competitor tracking into one place is what turns a weekend of tabs into an afternoon of shortlisting. That is the case for a paid product-research stack.
Related guide
Best product research tools for dropshipping
How the main stacks compare on price and coverage.
Disclosure: some links on this page are affiliate links. If you subscribe through them we may earn a commission at no extra cost to you. We tested every TrendTrack feature mentioned here on a paid account.
Want the four signals on one screen?
Filter 1.87M+ stores by growth, read estimated revenue, and rank live ads in one workspace. From $59/mo, or $41/mo billed annually. Ad spy starts on Pro ($89/mo).
FAQ
What is a winning product in dropshipping?
A winning product has demand you can prove, a margin you can defend, and a way to reach buyers with paid ads. It is not just a clip that went viral once. In practice, a winner shows sustained live ads, growing store traffic, and rising search interest, so the demand outlasts a single trend cycle.
How do you know if a product is actually winning?
Look for signals that repeat over time, not a one-off spike. A product backed by stores whose traffic and live ad counts are both rising, ads that have run for weeks, and steady or climbing search demand is far more likely to be real. Tools that estimate a store’s revenue and rank ads by performance help you separate a durable winner from a flash trend.
Where do dropshippers find winning products in 2026?
The reliable sources are competitor ad libraries, scaling Shopify stores, and search-demand tools, not endless scrolling. Reading which ads keep running and which stores are growing tells you what is selling now. A store-and-ad database like TrendTrack indexes 1.87M+ stores and 340M+ ads, so you can filter for scaling stores instead of guessing.
Can you still find winning products in 2026?
Yes, winning products never stop appearing; only the sourcing shifts. Saturation hits products that everyone copies at once, so the edge is spotting a scaler early and validating demand before you commit budget. The four-signal method in this guide, revenue, scaling stores, long-running ads, and search timing, is built to surface candidates before they saturate.
Do you need a paid tool to find winning products?
No, but it saves time. You can start with free sources: Google Trends, the TrendTrack free Chrome extension, and public ad libraries. Paid tools add speed and depth: estimated revenue, ad ranking, and competitor tracking. Note the gating, ad spy (the Ads and Advertisers modules) starts on Pro ($89/mo); Starter ($59) covers store search, two Brandtrackers, and the extension.