
Last verified July 17, 2026. Store and ad counts read live on a paid TrendTrack account on this date; plan prices and module gating last checked against the in-app Plans & Billing page on July 15, 2026.
The traffic is still coming. The sales are not. And the list of things you could fix has been sitting in your notes app for a month, forty lines long and growing.
That list is the problem. Not because the items are wrong, but because they have no order, so you keep picking the easy ones.
An audit fixes the order. You run the same checks, in the same sequence, and the sequence tells you what actually deserves your next hour.
A Shopify store audit is a structured pass over four things: traffic, offer, store experience and marketing engine. Score each of the 16 checks below as pass, caution or fail. Anything under 12 passes tells you where to work before you spend another dollar on ads.
Disclosure: some links on this page are affiliate links. If you subscribe through them we may earn a commission at no extra cost to you. We tested every TrendTrack feature mentioned here on a paid account.
How to run this audit
Sixteen checks, four phases, one sitting of roughly an hour. Score each check as pass, caution or fail, and resist the urge to fix anything until all sixteen are scored.
The phase order is not decorative. There is no point rewriting product copy if nobody lands on the page, and no point testing new creatives if the store they land on is broken. If you are early in your build and the fundamentals are still moving, start with our complete Shopify dropshipping guide and come back to this once you have real traffic to audit.
Here is the part most audit checklists skip. Your Shopify admin shows you the inside view: sessions, conversion rate, cart value, the numbers only you can see.
It never shows you the outside view: what a competitor sees when they look at your store from the street. Both halves matter, and the second one is the half you are missing.
| Signal | Your Shopify admin | The outside view adds |
|---|---|---|
| Traffic | Exact sessions, sources, devices | The same estimate your rivals see of you, and of them |
| Visitor countries | Where sessions came from | Visitor countries next to targeted countries |
| Prices | Your own catalogue | Best-seller price of every store in your niche |
| Tech stack | Your installed apps list | Theme, apps and pixels detected on any store |
| Ads | Your ad manager | Which of your ads are still live, and for how long |
| Revenue | Audited, to the cent | Estimated revenue for stores you will never see inside |
Phase 1: traffic, where it comes from and where it is going
Four checks. All of them are about direction, not volume, because a flat month tells you nothing and a falling quarter tells you everything.
- Traffic direction over 3 to 6 months. Not last week. Pull the curve on a 3M and a 6M window and say out loud whether it rises, flattens or falls.
- Visitor countries against targeted countries. If you pay for US impressions and most of the traffic lands from somewhere else, your targeting is leaking before your product page ever gets a chance.
- Growth rate, not just growth. Rising 2% over six months is a flat store with good manners. Set a real threshold and hold yourself to it.
- Traffic against ad spend. If the curve only climbs when the budget climbs, you do not have growth, you have rent.
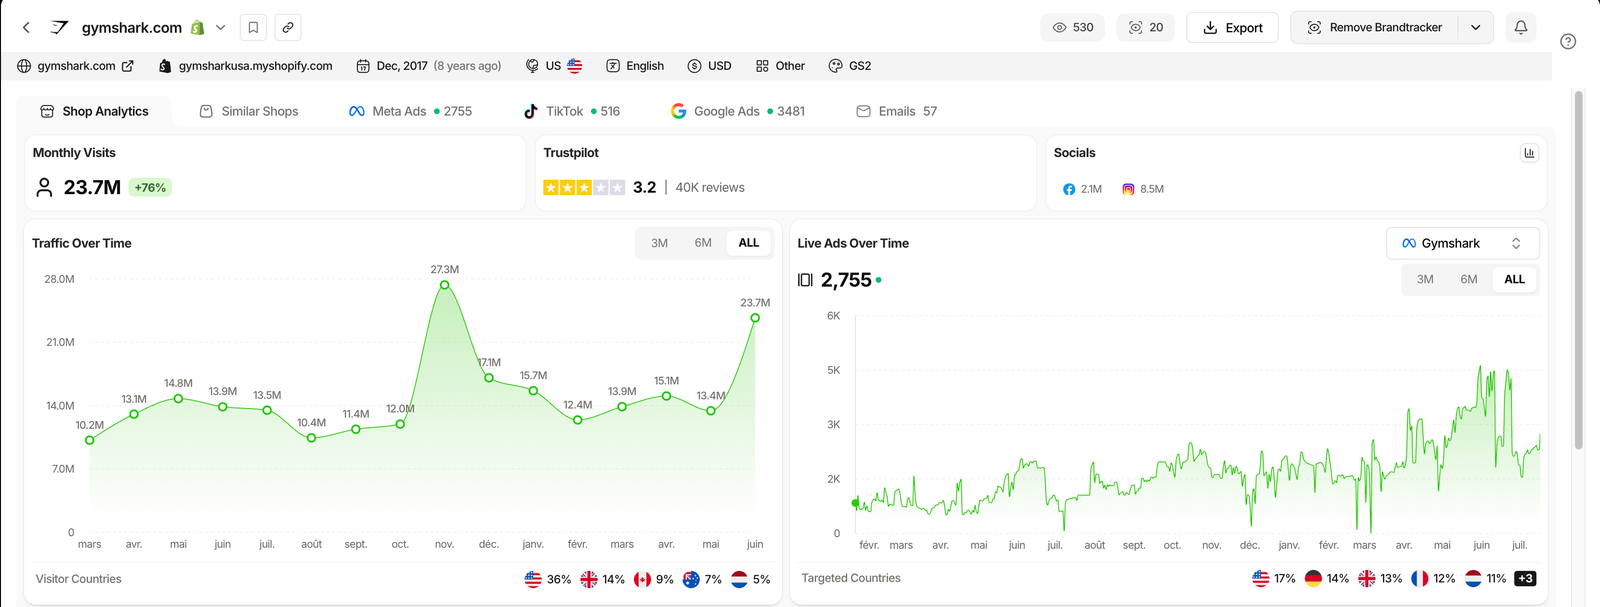
The country split is the check operators skip most and regret fastest. TrendTrack puts Visitor Countries and Targeted Countries side by side on a store’s analytics page, and the gap between the two is usually where the budget goes to die.
Treat these numbers as directional. Monthly visits read from the outside are an estimate, not your analytics.
Counters read on a paid TrendTrack account, checked July 17, 2026.
Phase 2: the offer, price, range and best sellers
Traffic that converts badly is often an offer problem wearing a conversion-rate costume. These four checks separate the two.
- Best-seller price. Where does your hero product sit against the stores selling the same thing? TrendTrack filters stores by their best seller’s price, from $0 to $10,000, which makes the comparison a query rather than an afternoon of tab-hopping.
- Range against focus. Four products or four thousand can both work. Neither works by accident, and most struggling stores are somewhere in the middle by drift.
- Launch cadence. When did you last ship a new product? A store’s product list carries creation dates, so this one is answerable in seconds, for you and for anyone auditing you.
- Revenue against traffic. High traffic with low estimated revenue points at conversion. Low traffic with healthy revenue points at acquisition. The ratio tells you which department to blame.
That last check leans on Est. Revenue, TrendTrack’s estimate of a store’s monthly and daily takings. It is hidden by default in the Shops column settings, which is honest of them, because it is a speedometer read from the outside, not the odometer inside the car.
Use it to compare, never to quote. An estimate that says a rival is around ten times your size is useful; the exact figure is not the point.
Phase 3: store experience, theme, apps, pixels and trust
Now, and only now, the store itself. Run the speed check with PageSpeed Insights on a product page rather than your home page, because that is where the money lands.
- Theme. Know which one you run, and whether the stores winning your niche run something else. TrendTrack counts stores per theme, so “everyone serious uses X” becomes a number instead of a forum opinion.
- Mobile speed. Test the product page, on mobile, on a real connection. Desktop scores flatter you.
- App bloat. Every installed app is a script that loads before someone can buy. Audit the list against what you actually use, and see the apps worth keeping in 2026 for the ones that earn their place.
- Pixels and trust. Are Meta, TikTok, Google Ads, GA and GTM actually firing? Does your Trustpilot profile have a score and enough reviews to be believed?

App bloat and missing pixels are the two findings that show up in almost every audit we have run. The first one costs you speed, the second one costs you the data you need to fix everything else.
Both are visible from the outside, on your store and on anyone else’s, which is what makes this phase quick.
Related guide
Shopify Theme Detector & App Finder
See the exact theme, apps and pixels behind any Shopify store.
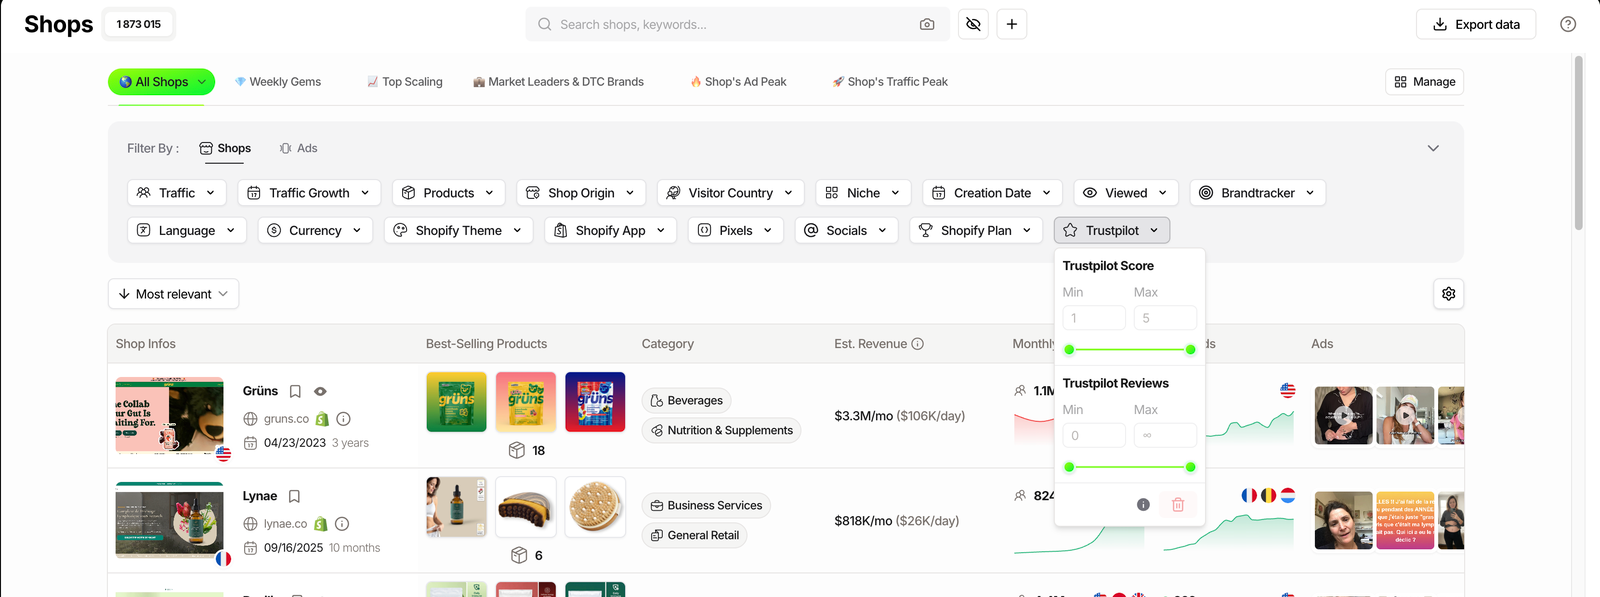
Trust is the check people argue with. A four-star profile with 900 reviews outsells a five-star profile with six, every time, and the filter above is how you find out what “enough reviews” looks like in your category.
Phase 4: the marketing engine, ads and email
The last four checks are the ones you were itching to start with. They are last on purpose. You can verify most of this for free in the Facebook Ad Library, on your own store as easily as on a rival’s.
- Live ads and how long they last. Ad count is vanity. Ads still running after three or four weeks are the ones paying for themselves.
- Media mix. What is your split of video, image and dynamic creative, and how does it compare to the stores outgrowing you? TrendTrack breaks the mix down as a percentage per store.
- Landing pages. If forty ads point at one page, you are not testing, you are hoping. The tracker ranks a store’s top landing pages by the share of ads sending traffic to them.
- Email flows. Do you have a Welcome flow and an Abandoned Cart flow, live, today? Across TrendTrack’s email index there were 513,810 Welcome emails and 1,117,339 Abandoned Cart emails on file as of July 13, 2026. Those two flows are table stakes, which is exactly why not having them is expensive.
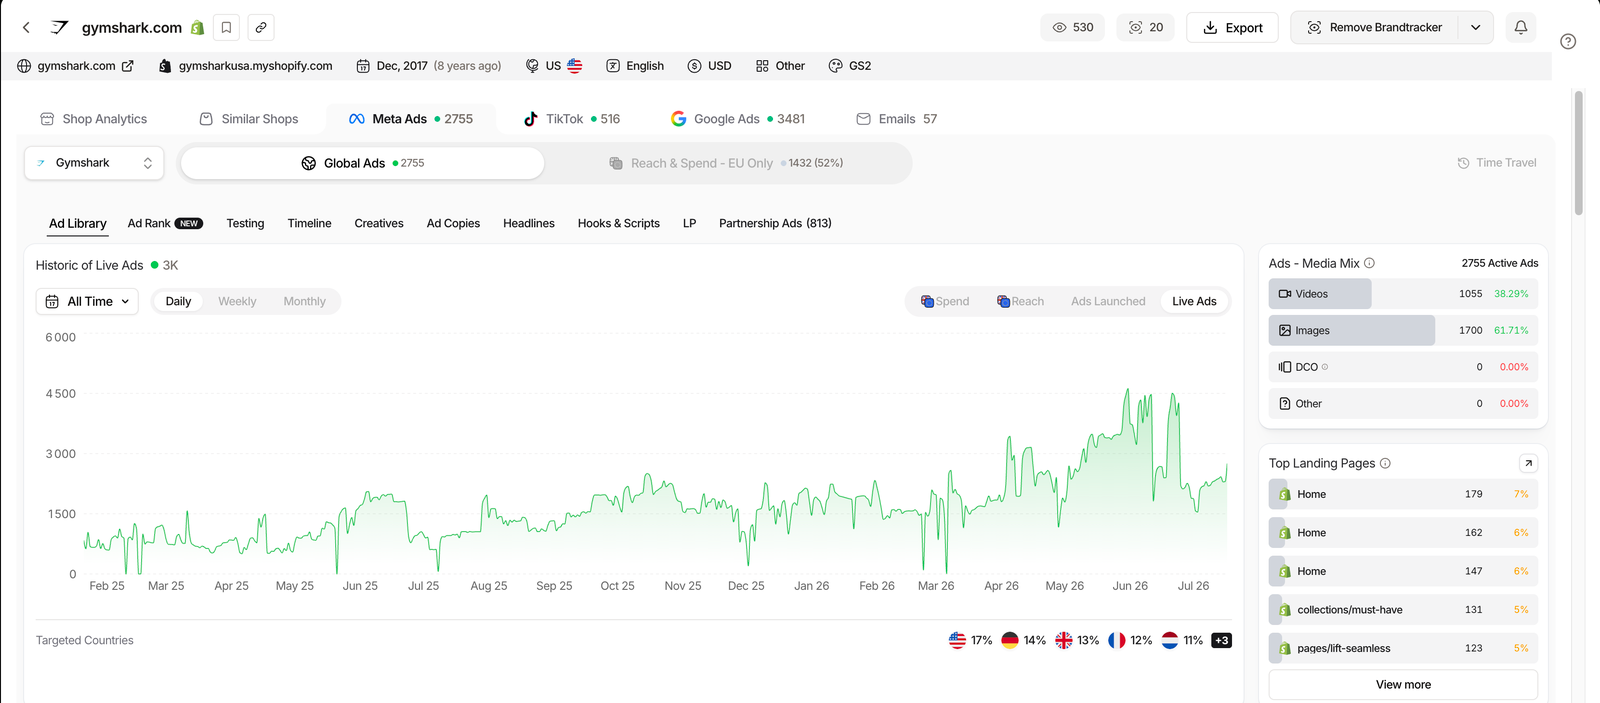
A Brandtracker follows one store’s entire funnel across Meta, TikTok, Google and email. Point it at your own store first, and you get the audit a competitor could run on you.
Plan check: phases 1 to 3 run on Starter ($59/mo), which includes the Shops module and 2 Brandtrackers. Phase 4 leans on the Ads and Advertisers modules, and those start on Pro ($89/mo). Three quarters of this checklist does not need the upgrade.
Score it: pass, caution, fail
Score a pass as 1, a caution as 0.5 and a fail as 0. Add them up and read the band, not the individual lines.
12 or more out of 16 means the foundations hold and your cautions are the work list. Between 8 and 11 means you have a real project on your hands, and more ad budget will only make the leaks louder. Under 8 means stop paying for traffic today and fix the store first.
Would you keep buying visitors for a store that scores 7? Most people do, which is why most stores stall.
Red flags that end the audit early
Some findings do not need a score. If one of these shows up on the right-hand side, you already know what your next month looks like.
Green lights
- Traffic flat or rising across 3 months
- Visitor countries match who you target
- Best seller priced inside its category window
- Something new shipped in the last 90 days
- Product page fast on mobile
- Pixels firing, Trustpilot with real volume
- Ads that survive past three weeks
- Welcome and Abandoned Cart both live
Red flags
- Three straight months of decline
- Most visitors from countries you never targeted
- No launch in six months
- Thirty apps, half of them forgotten
- No pixel firing anywhere
- Zero reviews, or six of them
- Every ad dead within 48 hours
- One landing page for every campaign
The full 16-point scorecard
Work down the table, one column at a time. The last column tells you where to look, free tools first, and the outside view when the check needs eyes you do not have from inside your admin.
| # | Check | What a pass looks like | How to check it |
|---|---|---|---|
| 1 | Traffic direction | Flat or rising over 3M | Shopify admin, or Traffic Over Time |
| 2 | Visitor vs targeted countries | Both lists broadly agree | Shop Analytics, two panels side by side |
| 3 | Growth rate | A threshold you set, and hit | Traffic Growth rules, 1m / 3m / 6m |
| 4 | Traffic vs ad spend | Curve holds when budget dips | Live Ads Over Time next to traffic |
| 5 | Best-seller price | Inside the window your niche sells at | Products filter, best-seller price range |
| 6 | Range vs focus | A deliberate catalogue size | Product count, yours and your rivals’ |
| 7 | Launch cadence | Something new in 90 days | Product creation dates, Last published |
| 8 | Revenue vs traffic | Ratio in line with your category | Read a store’s estimated revenue |
| 9 | Theme | Known, and fit for your niche | Shopify Theme filter, with store counts |
| 10 | Mobile speed | Product page, not just the home page | PageSpeed Insights, free |
| 11 | App bloat | Every app has a job you can name | Apps detected on the store page |
| 12 | Pixels and trust | Pixels firing, reviews with volume | Pixels panel, Trustpilot filter |
| 13 | Ad longevity | Ads still live after 3 weeks | Facebook Ad Library, or Ads module |
| 14 | Media mix | Deliberate, not one format by default | Ads Media Mix, per store |
| 15 | Landing pages | More than one page under test | Top Landing Pages, share of ads |
| 16 | Email flows | Welcome and Abandoned Cart live | Your ESP, or the Emails module |
Audit the stores that beat you, the same way
Here is the quiet advantage of running the audit from the outside. Nothing in those sixteen checks only works on your own store.
The same pass runs on any of the 1,873,015 Shopify stores in the index, including the ones in your niche that grew last quarter while you flattened. Turned outward, that is simply how to read a competitor’s store. That changes what your score means: you stop comparing yourself to a theoretical ideal and start comparing yourself to stores taking orders today.
Related guide
Top Scaling Stores This Week
The live view of the Shopify stores growing fastest right now.
You do not need to pay to start. TrendTrack’s Chrome extension has been free for everyone, with no usage limits, since it was rebuilt on March 13, 2026, and it x-rays a store’s stack in one click.
When you want the full pass, the four phases above, on your store and on your competitors, that is where the account earns its keep.
Pull the outside view of any store
From $59/mo, or $41/mo billed annually (-30%). Shops is on Starter; the Ads and Advertisers modules start on Pro ($89/mo).
FAQ
What is a Shopify store audit?
A Shopify store audit is a structured pass over four areas: traffic, offer, store experience and marketing engine. Instead of forty scattered ideas, it produces an ordered list of what to fix first.
The version on this page is 16 checks, scored pass, caution or fail. Under 12 passes out of 16, the store needs work before it needs more ad budget.
How often should I audit my Shopify store?
A full pass once a quarter is a sensible rhythm, because that is roughly how fast a store drifts: apps pile up, creatives age, prices in your niche move.
On top of that, re-check the traffic and ads points before any budget increase. There is no magic cadence, but auditing after you scale is auditing too late.
Can I audit a competitor’s Shopify store?
Yes, and this is the half your own admin will never give you. Estimated traffic, visitor countries, theme, apps, pixels, Trustpilot volume and live ads are all readable from the outside, on any store.
TrendTrack indexes 1,873,015 Shopify stores with 17 filters for exactly this. The Shops module is on Starter at $59/mo; the Ads and Advertisers modules start on Pro at $89/mo. Treat traffic and revenue figures as estimates, not audited numbers.
Do I need a paid tool to audit my store?
Not for half of it. Your Shopify admin, PageSpeed Insights and the Facebook Ad Library cover traffic, speed and live ads for free, and TrendTrack’s Chrome extension is free with no usage limits for a first look at any store’s stack.
A paid account buys you two things: the outside view of your own store, and the benchmark against real competitors rather than a theoretical ideal.
What should I fix first after a store audit?
Follow the phase order. Traffic and targeting come before the offer, the offer comes before the theme, and the theme comes before the creatives.
A fail in phase 1 makes everything downstream irrelevant, because better product copy cannot rescue visitors who were never the right visitors. Fix the earliest failing phase, then re-score.