Last verified July 2026. Database counters, pricing and every module below were checked hands-on on a paid TrendTrack account. Revenue and ad spend figures are estimates, never audited numbers.
A competitor store leaks seven distinct layers of data, and almost all of it is public in 2026. This page maps each layer, says where it actually lives, and marks the two or three places where the trail genuinely goes cold.
Most guides on this topic stop at the spreadsheet. Ours starts at the source of each cell.
Ecommerce competitor analysis means reading seven layers of a rival store: who they are, their traffic, their estimated revenue, their catalogue, their ads, their emails and their tech stack. Most of it is public. The work is not filling a SWOT sheet, it is pulling each layer with a date on it, then pulling it again later to see what moved.
Disclosure: some links on this page are affiliate links. If you subscribe through them we may earn a commission at no extra cost to you. We tested every TrendTrack feature mentioned here on a paid account.
Ecommerce competitor analysis, mapped
The classic method is well documented and worth crediting. Pick seven to ten rivals, compare products, pricing, marketing and site experience, then fold the findings into a SWOT matrix. The classic competitive analysis framework published by Shopify is the cleanest version of it.
That method is not wrong. It was built when the data was genuinely hard to reach, so it optimised for structure over sourcing.
TrendTrack database counters, checked July 2026. These counters grow every week.
What changed is the supply. Shopify storefronts are indexed at scale, EU and UK transparency rules force ad reach into the open, email flows are captured without you subscribing to anything, and a store’s theme, apps and pixels are readable from its own page source.
So the bottleneck moved. It is no longer access to the data, it is knowing which layer answers which question.
| Layer | What you can see | Free source | Faster route |
|---|---|---|---|
| 1. Who | Direct and lookalike stores in your niche | Manual browsing, Google | Similar Shops, 17 store filters |
| 2. Size | Estimated monthly visits, traffic trend | Similarweb free tier | Monthly Visits, Traffic Over Time |
| 3. Money | Estimated revenue per month and per day | N/A | Est. Revenue column |
| 4. Catalogue | Products, best sellers, prices, launch dates | Their storefront | Products tab with creation dates |
| 5. Acquisition | Live ads, creatives, hooks, landing pages | Facebook Ad Library, Google | Ads module, Brandtracker |
| 6. Retention | Email campaigns, flows, promo cadence | Subscribing yourself | Emails module |
| 7. Tech | Theme, apps, tracking pixels | Page source, BuiltWith | Theme, App and Pixels filters |
Each layer below is self contained. Read the one that answers your question this week, and leave the rest for when you need them. If you would rather run all seven on one rival end to end, here is how to analyze a competitor store step by step.
Layer 1: build the competitor set
Almost every competitor analysis is poisoned at step one. You list the brands you already admire, which means the biggest names in the niche, which means the least relevant benchmarks for your store.
The fix is to let the data name your rivals. Start from one reference store and open its similar stores, which surfaces comparable shops ranked by traffic, each with its live ad count, product count and estimated revenue.
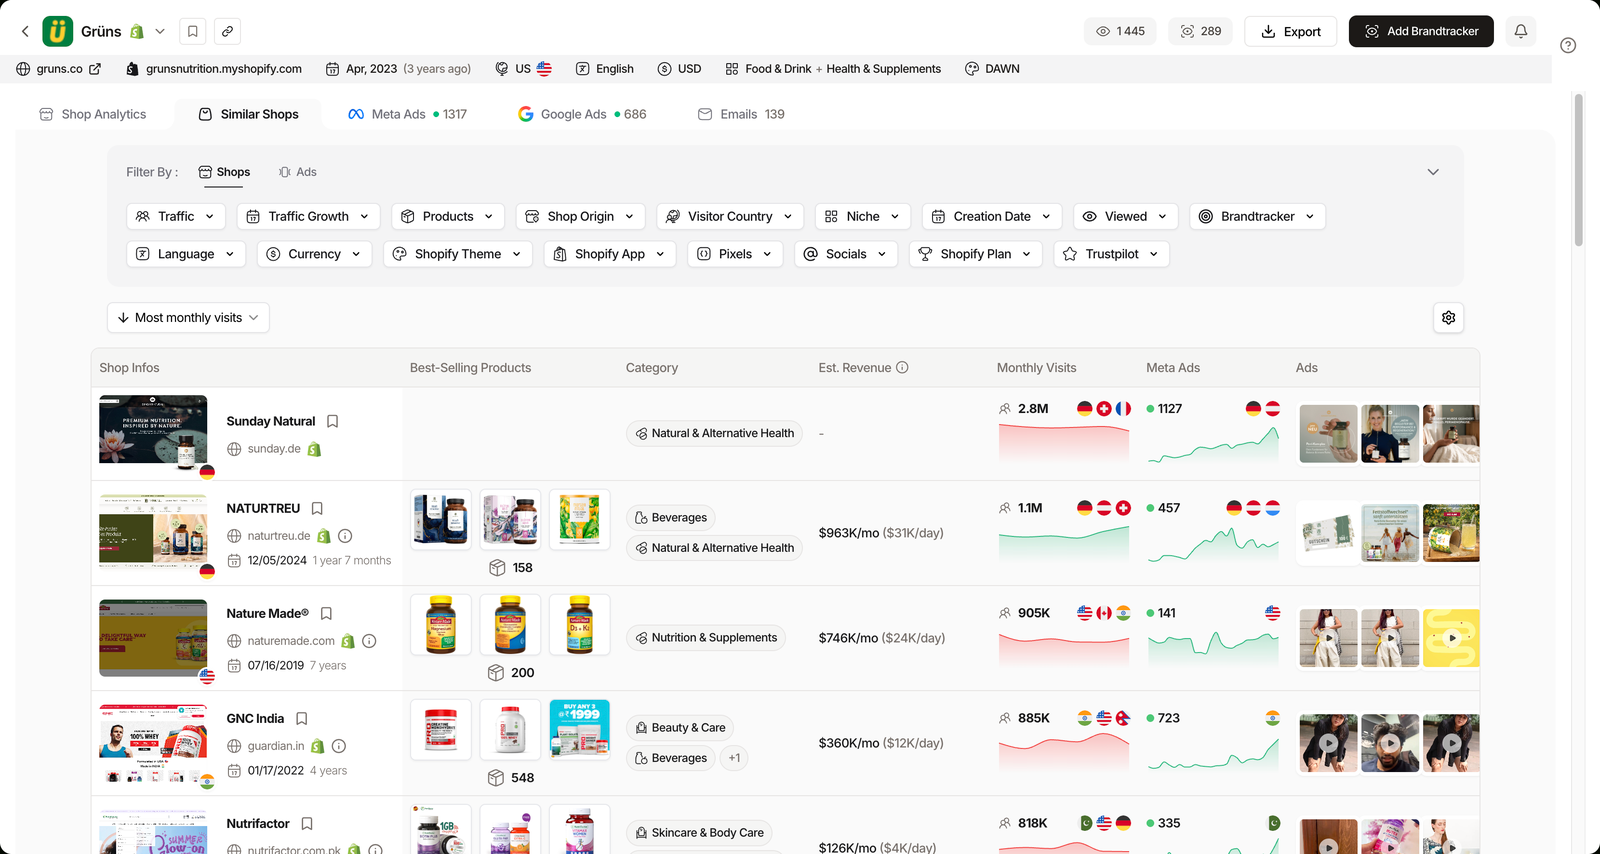
From there you widen with filters instead of intuition. Niche is the fastest cut, with 17 parent categories carrying live counters, and it stacks with traffic, product count, best-seller price, store creation date and visitor country. A store can sit in several niches at once, so treat the categories as overlapping, not exclusive.
This is exactly what a searchable database of Shopify stores is for: turning “who competes with me” into a query rather than a memory test.
Keep two groups. Direct competitors sell what you sell, and lookalikes chase the same buyer with a different product. The second group is usually where the surprises are.
Layer 2: size them up
Once the set exists, rank it. Estimated monthly visits plus the traffic curve over 3 months, 6 months or all time tells you who is actually growing versus who is simply old and large.
Traffic Growth rules are the sharper tool here, because you can ask for stores rising or falling by a minimum percentage over a 1, 3 or 6 month window. A rival falling 40% over six months is a very different study than one climbing at the same rate.
The most underrated panel on a store profile is the split between visitor countries and targeted countries. One shows where the traffic comes from, the other shows where the ads are pointed.
Reading a traffic gap
Ads pointed at a country that barely appears in their visitor mix usually means one thing: they are testing a new market and it has not landed yet.
The reverse gap, heavy organic traffic from a country they never target, is a market they earned by accident and have not monetised. That is the cheaper opening.
Revenue is the layer people want most and trust least, correctly. An estimated revenue figure per month and per day sits on each store profile, hidden by default behind the column settings. On our test account, Grüns reads at an estimated $3.3M/mo, or roughly $106K/day.
Use that as a size band, not a fact. It is modelled from public traffic and pricing signals, so it is directionally useful and precisely wrong.
Layer 3: products, prices and launch dates
A catalogue tells you what a store sells. The dates attached to it tell you what they are betting on right now.
Each product carries a creation date alongside its price, split across best sellers and recently published items. Read the recent tab and you are reading a competitor’s launch calendar, without buying a thing.
The signal most people miss: a cluster of products published in the same week is a test wave, not a restock. If those products are still live three months later, the test worked.
Prices work the same way in reverse. You can filter stores by product count, from 0 to 100,000, and by best-seller price between $0 and $10,000, which is how you find the stores actually operating in your price bracket instead of the ones that merely share your niche.
A $30 impulse store and a $300 considered-purchase store live in the same category and share almost no useful lessons. Filter accordingly.
Layer 4: acquisition, the ads they are running
This layer has real free doors, and they are worth using. The Facebook Ad Library shows every active Meta ad for any page, and Google’s Ads Transparency Center does the same for Google and YouTube.
What neither does is rank. They will show you forty creatives with no indication of which one is carrying the account, no history of how long each has run, and no way to cross a store’s Meta activity with its TikTok activity.
Plan check: the Ads and Advertisers modules start on Pro ($89/mo). Starter ($59/mo) covers unlimited Shops, 2 Brandtrackers, 30 email credits and the free Chrome extension, but not the ad layer.
A dedicated index closes that gap. Across 337M+ ads on Meta, TikTok and Google, you can sort by Ad Rank with presets for the top 20, 10, 5 or 1 percent, by Longest Active, or by Most Duplicates. Ad Rank shipped on January 29, 2026 and derives a ranking even where EU impression data is missing.
The public signal to trust is boring and reliable. An ad that has run for weeks and been duplicated across an account is winning, because sellers kill losers fast and clone what pays.
Related guide
How to Spy on Competitors’ Ads (2026)
The free libraries, the winning-ad signals, and where each one stops.
Layer 5: retention, their email machine
Email is the layer almost nobody audits, because the classic method requires subscribing to every rival with a burner address and waiting. Since March 16, 2026, that step is gone: the emails are already captured and searchable.
Two flows tell you most of what you need. Welcome sequences show how a store converts a first-time visitor, and abandoned cart flows show what they are willing to discount to rescue a sale.
Email flow and event counters, checked July 2026.
Seasonal events are filterable on their own, which is how you reverse engineer a promo calendar. Flash Sale sits at 159,716 emails and Christmas at 159,580, so you can read what a niche said last November before you write what you will say this one.
The output here is a cadence, not a swipe file. How often does a rival discount, how deep, and what do they lead with when they do.
Layer 6: tech stack, theme, apps and pixels
A storefront reveals its own machinery. Themes are detectable and countable, and so are the apps sitting on top: review widgets, email platforms, bundle builders, analytics.
That is useful for benchmarking your own build against the apps most Shopify stores actually run, rather than against whatever the last YouTube video recommended.
One caveat matters, and most tool reviews skip it. Detecting an app on a store proves the code is present, not that anyone is paying for it or using it well. Read detection as evidence of intent, not of success.
Pixels are the quieter tell. Before you look at a single creative, the presence of Meta, Google Ads, TikTok, Snap or Pinterest pixels tells you where a store is buying traffic, and their absence tells you where it is not.
What the SWOT sheet gets right
- Forces you to name rivals instead of gesturing at “the market”
- Produces one readable page a team can act on
- Costs nothing and fits on a napkin
- Ends in a decision, which is the point
What it misses
- No date, so you cannot tell what changed since
- No ad data beyond “they run Facebook ads”
- No trace of testing rhythm or launch cadence
- Filled by hand, so it is never filled twice
Layer 7: turn the audit into monitoring
Here is the pivot the whole page is built toward. A competitor audit is a photograph, and photographs expire. What compounds is a trace.
Since May 27, 2026, a single tracker slot covers an entire store rather than one Facebook page, pulling Meta, TikTok, Google Ads and emails into one view.
Three views carry the weight. Testing lays out a day by day timeline of test waves with active ad counts and reach ranges, Timeline draws a Gantt chart of every ad’s lifespan, and Time Travel lets you rewind the account.
That is the rhythm of a competitor’s testing operation, and no spreadsheet has ever captured it.
Notifications landed on July 7, 2026, with 7 events, delivery in app or by email, and an optional daily digest. They ship off by default, which is the right call: alerts you did not choose become noise within a week.
The spend layer is where monitoring beats auditing outright. EU and UK transparency exposes real reach, converted into an estimated spend through a configurable CPM set to $9 by default, so the number to watch is the slope from week to week rather than the value itself.
Related guide
EU/UK Ad Spend: Read a Competitor’s Real Budget
How reach becomes an estimated budget, and how far to trust it.
Pull all seven layers in one place
What this replaces, and what it does not
Two honest limits, because a method that claims everything gets trusted with nothing.
This does not replace a competitive SEO audit. Keyword rankings, backlink profiles and content gaps live in tools built for that job, and nothing above will tell you why a rival outranks you.
And nobody sees profitability. Not their real ROAS, not their margins, not audited revenue. Every revenue and spend figure on this page is modelled from public signals, which makes it a comparison tool rather than a quotable number.
| Layer | Spreadsheet audit | Tracked monitoring |
|---|---|---|
| Competitor set | Limited (from memory) | Yes |
| Traffic and revenue | Limited | Yes (estimated) |
| Products and prices | Yes | Yes (with launch dates) |
| Ad creatives | Limited (free libraries) | Yes |
| Estimated EU ad spend | No | Yes |
| Testing rhythm | No | Yes |
| Email flows | Limited (if you subscribe) | Yes |
| Tech stack | Yes | Yes |
| Re-measured over time | No | Yes |
| Cost | Free, plus your hours | From $59/mo, ads from $89/mo |
None of this retires the SWOT matrix. It just demotes it from method to output: the summary you write once the seven layers are on the table, dated and re-pullable.
FAQ
What is ecommerce competitor analysis?
Ecommerce competitor analysis is the process of reading what a rival store publicly exposes and turning it into a decision. In practice that means seven layers: who your competitors actually are, their estimated traffic, their estimated revenue, their catalogue and prices, the ads they run, the emails they send, and the tech stack behind the storefront. The classic version stops at a spreadsheet and a SWOT matrix. The useful version puts a date on each layer so you can pull it again next month and see what moved.
How do you find your real ecommerce competitors?
Do not start from memory, because you will list the brands you already admire rather than the ones taking your customers. Start from one reference store and open its similar stores, then widen with filters: niche, monthly traffic, product count, best-seller price range and country of visitors. TrendTrack indexes 1,873,015 Shopify stores with 17 filters, which is enough to build a set of direct and lookalike competitors in a few minutes rather than from a hunch.
Is there a free ecommerce competitor analysis template?
Plenty exist, and the free templates from Shopify and similar sources are fine as an output format. The catch is that a template only tells you which boxes to fill, never where the data lives. A blank cell for “ad spend” or “best seller” does not fill itself. Use a template as the summary you write at the end, and spend your actual time pulling each layer from a public source with a date attached, so you can compare the same cells three months later.
Can you see how much a competitor spends on ads?
Not exactly, and anyone claiming an exact figure is guessing. EU and UK transparency rules publish the reach of ads served in Europe, and tools convert that reach into an estimated spend using a configurable CPM, set to $9 by default in TrendTrack. That gives you a directional number for European impressions, not audited global spend. Treat it as a trend line to compare week over week rather than a budget you can quote.
What can you not learn about a competitor?
Three things stay private. Their real revenue, since every revenue figure you see anywhere is an estimate built from traffic and pricing signals. Their true ROAS and margins, because no public source exposes account-level performance or landed cost. And their intent, meaning you can see a product launched on a date but never why. Competitor data tells you what is happening and how fast, not whether it is profitable for them.
Do you need a paid tool for ecommerce competitor analysis?
No, not to start. The Facebook Ad Library, Google’s Ads Transparency Center and a free Chrome extension already show live creatives and let you x-ray a store’s theme, apps and pixels. You move to a paid tool when you want to sort ads by what is actually winning, read estimated EU spend, see email flows, and track a store over time instead of re-checking it by hand. In TrendTrack, the ad layer starts on the Pro plan at $89/mo, since the Ads module is not included in the $59 Starter plan.
The bottom line
Ecommerce competitor analysis stopped being a research problem somewhere around the point where a million and a half storefronts became queryable and ad transparency became law. It is now a reading problem.
Pick three rivals, not ten. Pull the seven layers once, put the date on it, and set the trackers so the second pull costs you nothing.
If you want the whole stack behind one login, you can run it on a TrendTrack account from $59/mo, or $41/mo billed annually, keeping in mind the ad layer opens on Pro at $89/mo. The Chrome extension is free either way, and it is a fair place to see whether any of this changes how you look at a store.