
Last verified July 17, 2026. Every screen below was read on a paid TrendTrack account; plan prices and module gating checked against the in-app Plans & Billing page on July 15, 2026.
Someone drops a domain in your group chat. This store is all over your feed right now, and apparently it is eating your niche.
You open it. You scroll the homepage, look at two product pages, note that their prices are a bit lower than yours, and close the tab.
Nothing you saw changes anything you will do tomorrow. That is not a discipline problem. You opened the store without a question, so the store gave you an impression instead of an answer.
Analyzing a competitor’s store takes three passes, not one audit. Ten minutes and no budget gets you their price point, their live ads and their tech stack. An hour on a paid account adds estimated traffic, launch dates and which ads are actually winning, and a tracker keeps the file current instead of letting it age.
Disclosure: some links on this page are affiliate links. If you subscribe through them we may earn a commission at no extra cost to you. We tested every TrendTrack feature mentioned here on a paid account.
The tab you close having learned nothing
Data access is not your bottleneck. A Shopify storefront is a public document, the ads are published by law in Europe, and the tech behind the page announces itself to anyone who looks. The bottleneck is that most people open a rival without deciding what the answer would change.
One more scope note before we start. This page reads one store, the one whose domain you already have. Working out who your rivals even are, and comparing seven of them side by side, is a different job covered in the wider competitor analysis playbook.
Three passes, not one audit
The classic method deserves credit before we move past it. Identify your competitors, compare products and pricing, evaluate their marketing, audit the experience, summarise in a matrix: the classic step-by-step framework is the tidiest version of it, and it currently owns this search result.
It is not wrong. It was written for a market where the data was hard to reach, so it optimised for structure.
Structure was the scarce thing. It no longer is.
One store, gymshark.com, read on a paid TrendTrack account, July 17 2026. Visit figures are estimates.
That is a single competitor. Not a market, not a category. One domain, and it already exposes more surface than any spreadsheet will absorb in an afternoon.
So the question stops being “what do I put in the grid” and becomes “how deep do I need to go today”. Three passes, each one costing more than the last, each one answering a different kind of question.
Each pass assumes the one before it. Pass 1 disqualifies, pass 2 decides, pass 3 maintains. Most stores you look at should never make it past pass 1, and that is the point.
Pass 1: the ten-minute read, free
Their storefront tells you the price point
Start with what the store hands you for nothing. The entry offer, the hero product, the price of the thing they clearly want you to buy first.
You are answering one question here: are we even in the same stadium? A rival selling a $180 hero product is not your competitor just because you share a category, whatever your group chat says.
The public ad libraries tell you what is live
Two free, official windows show you the creatives running right now. The Facebook Ad Library covers Facebook and Instagram. Google’s Ads Transparency Center covers Search, YouTube, Display and Shopping.
Both are genuinely useful and neither costs a cent. What they will not do is sort. They show you twenty live ads flat, with no way to tell which one is carrying the budget, how long it has run, or what the same brand is doing on the other platform.
The free extension x-rays the stack
The last free move is to x-ray the storefront itself: theme, apps, pixels. TrendTrack’s Chrome extension does this and has been free with no usage limits since March 13, 2026, no paid account attached.
Pixels are the underrated read. Before you look at a single ad, the pixels on a page tell you which platforms a store actually buys traffic on.
What ten free minutes give you
- Their price point and entry offer
- The creatives running today
- Theme, apps and pixels
- Enough to disqualify a store fast
What they cannot give you
- Any history, or a traffic trend
- Which ad is actually winning
- One platform at a time, never crossed
- Nothing dated to re-read next month
Ten minutes is enough to disqualify a store. It is never enough to copy one.
Pass 2: the one-hour read
What you buy in pass 2 is history and sorting. A public library shows you the present tense. An index shows you the trajectory, which is the only part that tells you whether a store is climbing or coasting.
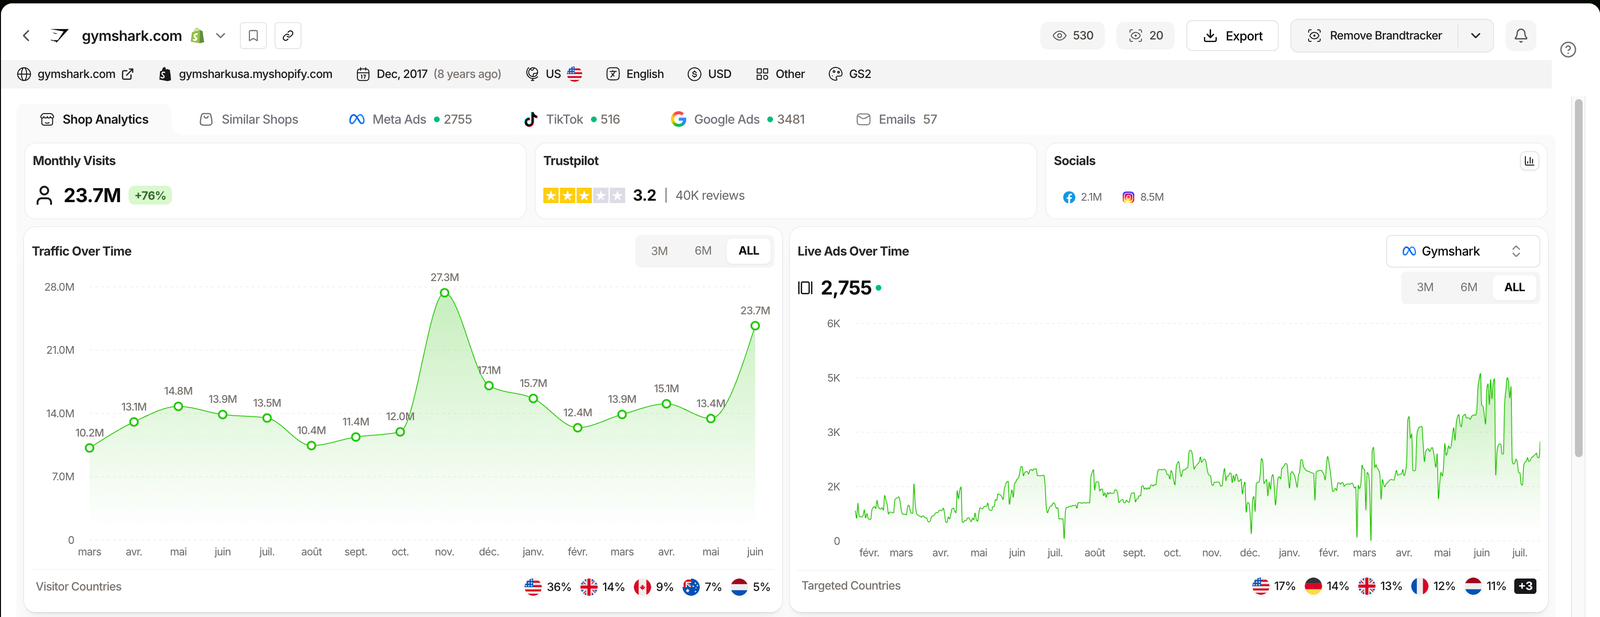
The store page opens on the numbers you cannot get for free: estimated monthly visits with their evolution, and a Traffic Over Time curve you can read at 3M, 6M or all time. A store whose curve has been flat for six months is a very different competitor from one that doubled since spring.
Then the read that most people miss entirely: Visitor Countries against Targeted Countries. One tells you where their organic traffic actually comes from, the other where their ads point. When those two diverge, you are watching a store push into a new market in real time.
| Screen | What it shows | The decision it feeds |
|---|---|---|
| Visits and Traffic Over Time | Estimated visits, plus the 3M, 6M or all-time trend | Whether they are climbing or coasting, before you copy anything |
| Visitor vs Targeted Countries | Where traffic comes from, against where the ads point | Which market they are pushing into right now |
| Est. Revenue | An estimated figure per month and per day, hidden by default | A size bracket, never an audited number |
| Products | Best sellers, last published, prices, a creation date each | Their launch calendar, and the price carrying the store |
| Meta, TikTok, Google ads | Live creatives, rank, days running, duplicates | Which angle they trust enough to keep paying for |
| Emails | Their campaigns and their automated flows | Their promo cadence and their retention hooks |
| Pixels and apps | Where they buy traffic, what runs the storefront | The stack you would have to match, if you should at all |
Their catalogue has dates on it
The products tab splits into best sellers and last published, with a price and, crucially, a creation date on every product.
That date turns a product list into a launch calendar. You can see what a rival shipped in March, what they added last month, and which of those they are now putting money behind. No purchase required, no burner account, just a column most people never look at.
Their ads, sorted by what is winning
The ads index covers over 337 million ads across three platforms. TikTok landed on June 8, 2026 and Google on July 1, 2026, which matters because a store that looks quiet on Meta is often loud somewhere else.
Plan check: the Ads and Advertisers modules start on Pro ($89/mo). Starter ($59) covers unlimited Shops, 2 Brandtrackers, 30 email credits and the free Chrome extension, but not the ad layer.
Sorting is what you are paying for. Ad Rank (shipped January 29, 2026, with presets for the top 20%, 10%, 5% and 1%) floats the likely scalers. Longest Active and Most Duplicates do the rest: an ad that has run for months and been duplicated a dozen times is the clearest public signal a creative works, because nobody keeps paying for a loser.
Related guide
How to Spy on Competitors’ Ads
The ad layer on its own, from free libraries to ranked creatives.
Their emails and their stack
The email index holds 6,076,119 campaigns, collected without anyone subscribing to a burner inbox since March 16, 2026. Two flows are worth your time before any of the rest: Welcome (513,810 indexed) and Abandoned Cart (1,117,339), because they are where a store shows what it says to someone who almost bought.
The stack closes the pass. One honest caveat: a detected app is a fingerprint on the page, not proof of a paid subscription, and the app filter carries no public counter. Read it as evidence, not as a receipt.
Pass 3: the standing read
Everything above expires. A one-off pull is accurate the day you run it and quietly wrong six weeks later, which is how competitor docs end up as fiction nobody reopens.
The fix is a tracker rather than a habit. Since May 27, 2026 one Brandtracker slot covers a whole store, all of its Facebook pages included, across Meta, TikTok, Google Ads and emails.

The Timeline is where a competitor stops being a brand and becomes a rhythm. Every ad gets a bar: when it launched, how long it survived, whether it is still breathing.
Sorted by newest, the pattern jumps straight out: every one of this store’s latest creatives is a short test, two days wide. Sort by longest active instead and the bars that have carried the account for months rise to the top.
Two views sit next to it. Testing breaks the launches down day by day, so you can see the waves, and Time Travel puts the whole thing on a date you choose.
No spreadsheet has ever captured a competitor’s test cadence. By the time you have typed it, it changed.
Related guide
Brandtracker Tutorial: Track a Store’s Ads, Tests, Emails & LPs
How the Brandtracker follows a whole store, tab by tab.
Then you stop visiting. Notifications shipped on July 7, 2026: seven events, delivered in-app, by email or both, with a daily digest at an hour you set. They are off by default, so nothing reaches you until you decide it should.
Read the numbers honestly
One line runs through everything above, and getting it wrong is how people embarrass themselves in public. Some of these numbers are observed: how long an ad ran, how many times it was duplicated, the date a product went live.
Others are modelled: visits, estimated revenue, estimated spend. Both are useful, but they do not get quoted the same way.
| Signal | Where it comes from | How far it goes |
|---|---|---|
| Monthly visits | A third party traffic model | Directional. Compare the trend, not the absolute |
| Est. Revenue | Modelled from traffic and pricing signals | A bracket. Never quote it as their revenue |
| EU/UK ad spend | Published European reach, converted at a CPM you set ($9 by default) | European impressions only, estimated, useful week over week |
| Ad Rank | Derived from Facebook data, works without EU impressions | Relative, inside the index. A shortlist, not a score |
| Days running, duplicates | Observed by the index | Solid. Time and repetition are facts, not models |
| Detected apps and theme | A storefront fingerprint | Detection, not proof of a paid subscription |
| ROAS, margin, real revenue | N/A | Not available anywhere. Anyone quoting it is guessing |
So when a store shows up at an estimated $3.3M per month, roughly $106K per day, that is a bracket telling you which league you are looking at. It is not their bank statement, and repeating it as one is how you get corrected in your own comments.
What stays private is the interesting part: their real margin, their true ROAS, and their intent. You can see a product went live on March 3, and you will never know why.
Competitor data tells you what is happening and how fast, never whether it is working for them.
FAQ
What are the 5 steps of a competitive analysis?
The classic answer, and the one most results repeat, runs like this: identify your competitors, analyze their products and pricing, evaluate their marketing, audit their brand and user experience, then summarize it in a SWOT matrix. It is a sound teaching frame and it predates public store data. Applied to one store in 2026, those five steps compress into three passes: a free ten-minute scan, a one-hour data pull, and a tracker that keeps the file current instead of letting it age in a spreadsheet.
What are the 4 P’s of competitor analysis?
The 4 P’s are product, price, place and promotion, borrowed from the marketing mix and pointed at a rival instead of yourself. For a Shopify store they map cleanly onto things you can actually see: product means their catalogue and launch dates, price means their best-seller price point, place means the countries their traffic comes from versus the ones their ads target, and promotion means the ads and emails they run.
The frame is fine. The work is filling it with dated evidence rather than impressions.
How do you analyze a competitor’s Shopify store for free?
Start with the storefront itself for the price point and the entry offer. Then open the Facebook Ad Library and Google’s Ads Transparency Center to see which creatives are live right now. Then x-ray the storefront with a free Chrome extension to read its theme, apps and pixels.
That costs nothing and takes about ten minutes. What it will not give you is history, a traffic trend, or any way to sort ads by which one is actually winning.
Can you see how much a competitor store makes?
No, and every figure you see anywhere is an estimate. Tools model revenue from traffic and pricing signals, which is why TrendTrack shows Est. Revenue as a column that is hidden by default, with a monthly and a daily figure.
Treat it as a size bracket: it tells you whether you are looking at a six-figure store or an eight-figure one. It does not tell you their margin, their ad spend, or whether any of it is profitable.
How do you find a competitor’s best-selling product?
Their storefront usually flags it, and the store page in TrendTrack lists products under Best Seller and Last published tabs with a price and a creation date on each one. The date is the underrated part: it turns a product list into a launch calendar, so you can see what they shipped in March and what they are pushing now. Cross it with the ads still running behind that product and you have a decent read on what is carrying the store.
How often should you re-analyze a competitor’s store?
It depends on the decision. A one-off scan is fine when you are deciding whether a niche is worth entering, and it will be stale in a few weeks. If you are actively testing against a store, the useful cadence is continuous rather than monthly: a Brandtracker follows the whole store and can fire notifications on seven events, in-app or by email, with a daily digest.
Notifications are off by default, so nothing happens until you turn them on.
The bottom line
Pick the pass, not the tool. Ten free minutes settle whether a store is even your competitor.
An hour settles what they sell, who they sell to and which ad pays for it, and that hour costs from $59/mo, or $41/mo billed annually, with the ad layer starting on Pro at $89. A tracker is for the two or three stores whose next move would actually change yours.
The last move is the one nobody makes. Every screen in pass 2 exists for your own domain too, and the numbers are less flattering when you run the same audit on your own store.
Read a rival on a paid account for an hour, then spend the second hour reading yourself the same way.